Visualising the Internationalisation of Roller Derby (part 1 of 2)
Recently, we've been including some more analytics content on the blog, with included content here and some links from articles to more detailed discussions on the author's personal wordpress. In order to improve our analytics, it's important to have a big set of real world measurements to compare to - you can use these to train your model, and then also to test the new model's predictive power (obviously you use different subsets of your data for training and testing).
Luckily, FlatTrackStats has a very large and complete set of bout records for flat track roller derby, dating back to the very first bouts in 2003. Even more luckily, the FlatTrackStats guys are committed to openness of data, so their records are licensed Creative Commons: Non-Commercial (this means that anyone can use their data for free, as long as they credit FTS, and don't try to profit from whatever they're doing).
In the interests of paying this forward (and because the author also personally believes that it's in the best interests of roller derby to not restrict information unless absolutely necessary), this article and all images therein is licensed Creative Commons: Non-Commercial-ShareAlike (you can reuse this article, and the images therein for anything, as long as you credit me as the source, don't profit from your actions, and share your resulting things under exactly the same license).
Now that we have the FlatTrackStats team and bout databases, up to the last week, we need to process the data in order to make it useful for our model. Part of this processing involves dividing up all of the teams (for any given period of dates) into subsets, such that everyone in a subset has played at least one person in that subset. And if you're doing that kind of processing anyway, you end up writing some tools to visualise the resulting subsets just to check on them... and it turns out that this kind of visualisation is historically interesting in itself.
This article presents the result of some visualisations of the partitions of Flat Track Roller Derby for each year, starting from 2005 (which is really when the first teams solidified from the experimentation in 2003-4). As this data is taken from the FTS bout database, it only includes bouts which teams submitted to FTS (or which were in the DNN derbymatic database, which was also rolled into FTS when DNN closed). We also exclude Exhibition and Home teams from our plots, which mostly has effects for Men's and Coed derby post 2010. Teams are represented by circles, with lines connecting them representing a bout between those teams in the time period covered. The plotting algorithm treats connections like elastic bands, so groups of teams who all played each other are drawn into dense central regions of the plot by the forces between them, while less connected groups are pushed out to the edges.
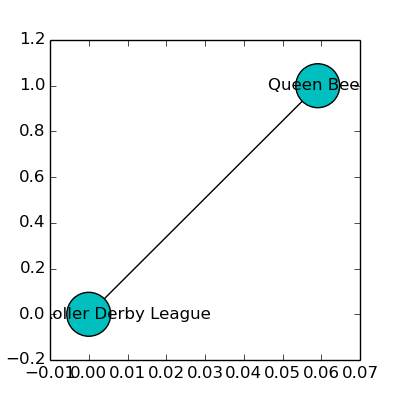
Looking at 2005, Women's Flat Track Roller Derby was in its infancy. In fact, there are only 9 travel teams known to FlatTrackStats for the period 1 Jan 2005 to 1 Jan 2006, and of course all of them are in the USA. If we partition them into the groups which played each other, we find that there's one "big" group, with 5 members, and 2 small groups with a pair of teams a piece. (It turns out that most of the "isolated" groups we find in any year are 2 or 3 member groups, with teams who are just starting out and only really played one game that year.) The members of the big group are quite familiar today:
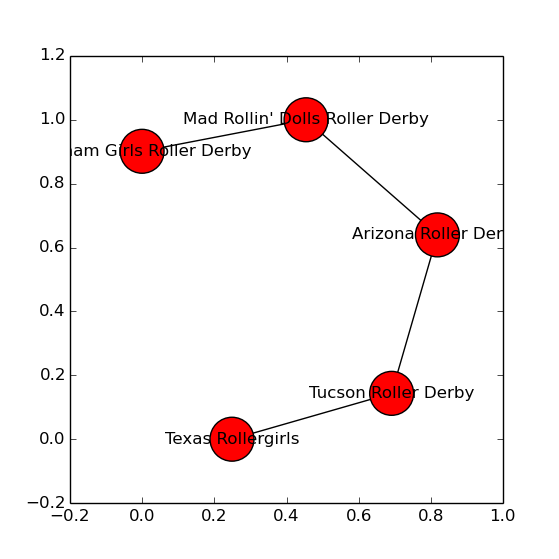
(that's Gotham just sliding off the left edge of the graph).
There are no Men's, Junior or Coed teams at this early stage of Flat Track Derby, of course. But Women's Derby is growing rapidly. Moving on to 1 Jan 2006 to 1 Jan 2007, many new teams have started up, mostly in the USA, but with one in Canada. And almost all of them (except one pair of teams) have played at least one other team in the biggest group:

But, in 2007, something new happens. There's the continuing explosion of USA derby (the biggest group by far):

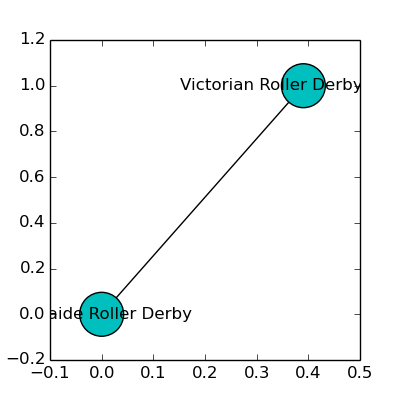
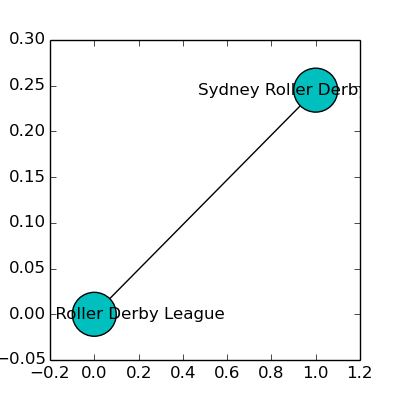
By the end of 2008, the European Derby seed is beginning to grow, but they're still entirely separate from the big connected group in the USA. As well as a smattering of teams in the USA and Canada who only played one bout in 2008, there's also the beginning of Cyan on our graphs, with Adelaide Roller Derby playing Victorian Roller Derby League for the first Australian derby on the Flat Track. These are both trends that continue into the end of 2009, with three entirely disconnected centres of Derby developing:
The big USA/Canada (where you can see the tightly linked central bunch of "Division 1" teams continuing to dominate derby):


The nascent Australia (so early that we have 6 teams, each of which played only one bout):
 |
 |
 |

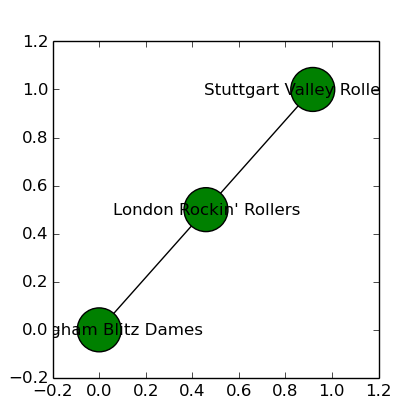
Firstly, Europe finally contacts the USA, with London Rollergirls playing their first bouts across the Atlantic. Given the isolation of USA derby from the emerging European and Australasian areas, the ability of London surprises a lot of their opponents (setting a trend for both reactions to London, and reactions to non-US teams in general when visiting the USA).
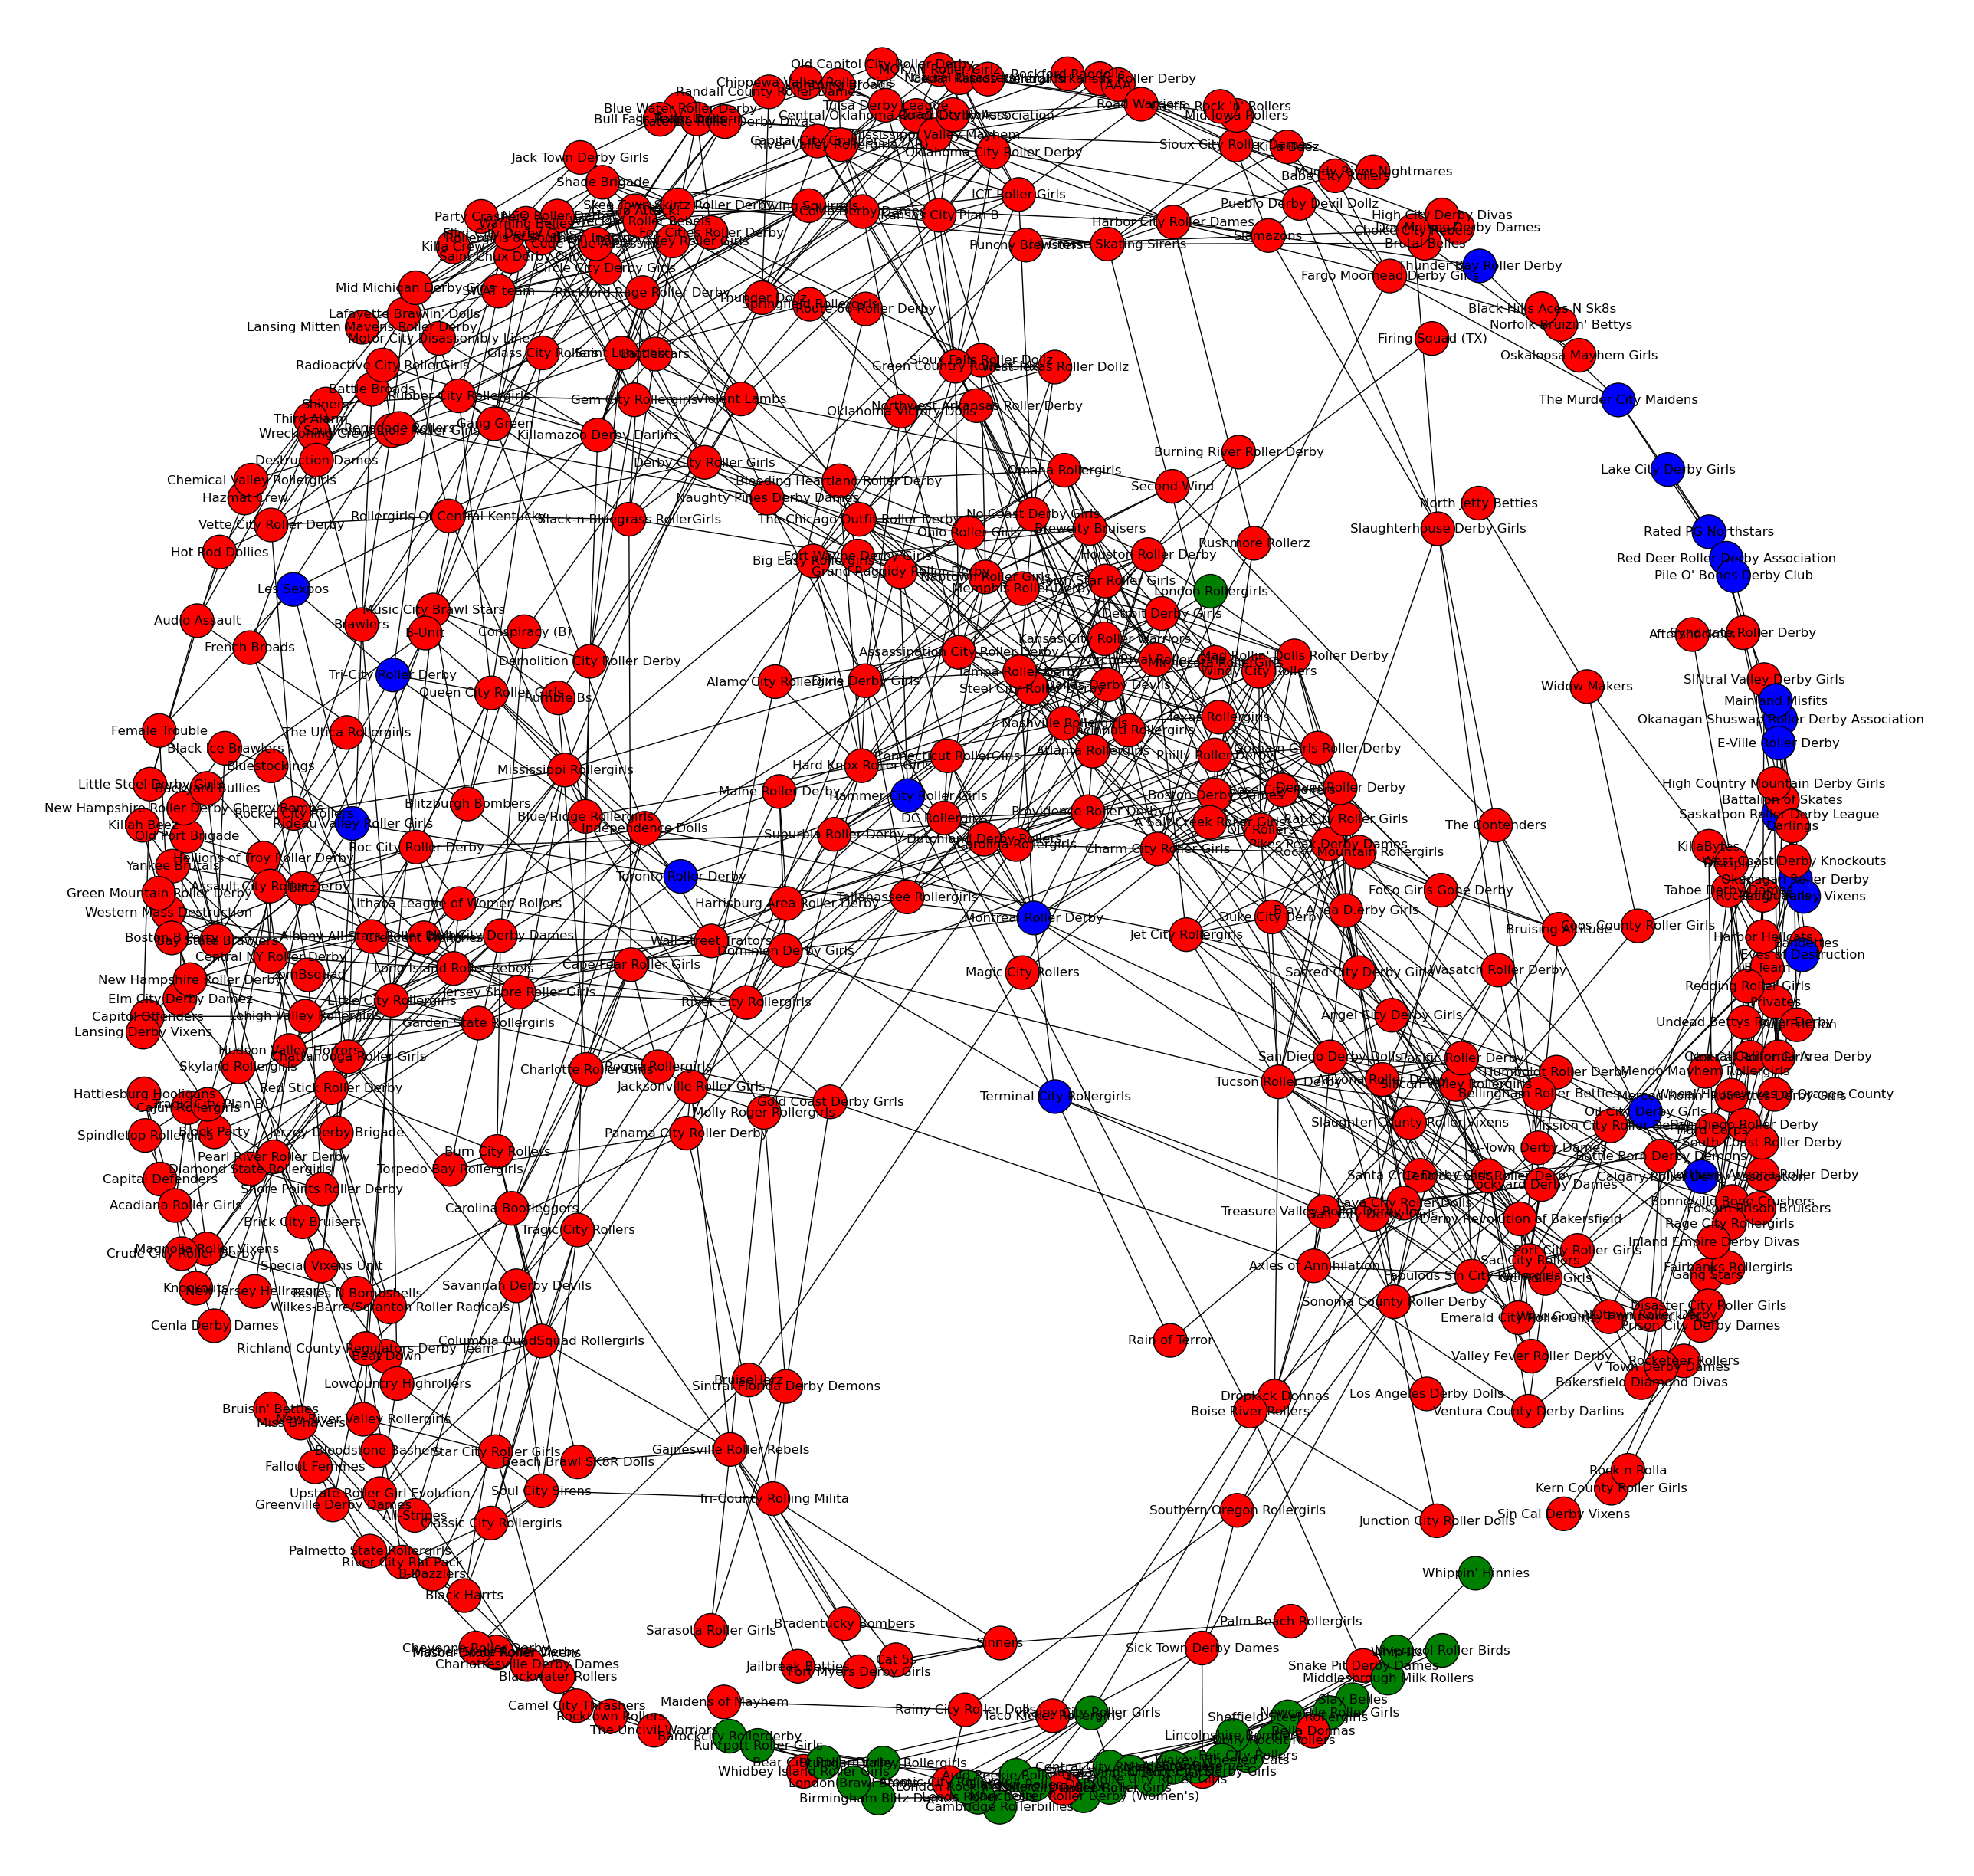 (the Green dot in the middle of the Red central dots is London, while the rest of Europe is relegated to the edge, due to lack of connections to the dense nexus of Important USA Teams). Edit: interestingly, London A is already isolated from Europe by this point - they only played US teams in 2010. It is Rainy City who connect Europe with the USA, having played Oly Rollers B.
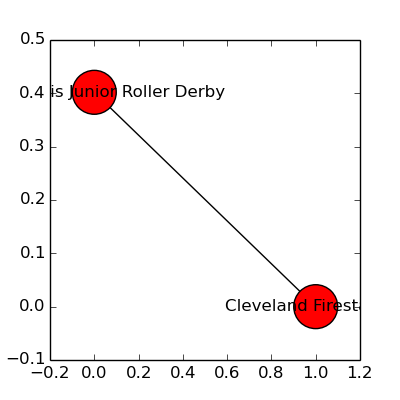
Secondly, the very first Junior derby starts up (this is Cleveland Firestarters (who were later replaced by Cleveland Junior Roller Derby) v Indianapolis Junior Roller Derby).