Gotham, Rose, Victorian: a three-way tie?
Previously in our strand on statistical analysis of Roller Derby, we've applied various toolsets from statistics to ranking tournaments and regions. To date, however, all of these approaches have been drawn from a single philosophy, the "frequentist" approach to statistics. We're going to apply a different approach in this article, to examine what we can say about the relative strengths of London Rollergirls, Gotham Girls Roller Derby, Rose City Rollers and Victorian Roller Derby League in the aftermath of an incredibly closely contested WFTDA Championships.
Briefly, there are essentially two main philosophies, diametrically opposite in approach, to statistical inference. "Frequentist" approaches attempt to determine how likely your observations are for a given reality, while Bayesian approaches are concerned with how likely a given reality is, given the observations you've made. (To put it another way: Bayesian statistics is all about determining the range of certainty you can have about reality.)
We've mostly been using frequentist approaches to our modelling here, because Bayesian techniques often require a lot more computational effort to produce results. In order to determine the range of possible true values, you have to examine a large number of possibilities - and the size of the space to explore grows rapidly with the number of options. For the 1200 or so Women's Teams in the Flat Track Stats database, each possibility we'd have to compare would be a list of 1200 values, each a possible strength for an individual team. It's fairly clear that this gives a huge space of possibilities, which would be exceptionally hard to properly search and characterise.
For the WFTDA Championships, however, there's a much smaller space to explore - only the possible strengths of the 12 attending teams need to be explored. While this is still a 12 dimensional space, it's definitely a tractable problem, with a few hours of computer time, and a few gigabytes of memory.
We used the python package emcee to perform the relevant Bayesian inference. Taking the results of all of the games at WFTDA Champs, we assumed that the performance of any team would vary in a "Gaussian" manner around their true strength. As we don't strictly know how much variation a team would have in their performance, we explored the possible values of this variation (the standard deviation, usually represented by σ) along with the strengths of the teams*.
In order to provide a more constrained search space, we also assumed that teams wouldn't vary in performance by more than a factor of two, and that the best teams would be less than about 8 times better than the worst, and that no team would be more than about 1.6 times better than Victorian Roller Derby League.**
We ran approximately 5 million samples of possible strengths and σs against the results of WFTDA Champs.
We also ran another 5 million samples of possible strengths, with σ fixed to the most likely value (0.2, roughly corresponding to a natural variation of about 14% in team performance from game to game***).
From these results, we can plot so-called "corner plots", which project the full 12 dimensional space of possible team strengths into nice 2-d contour plots and 1-d histograms so we can visualise them easily.
Because we have only 12 games as input data, there's quite a bit of statistical uncertainty in the true strengths of the teams involved. What we're mostly concerned about is what we can say about the possible "true" strengths of London, Gotham and Rose, relative to Victorian, so we're only going to reproduce the corner of the full plot which shows this.
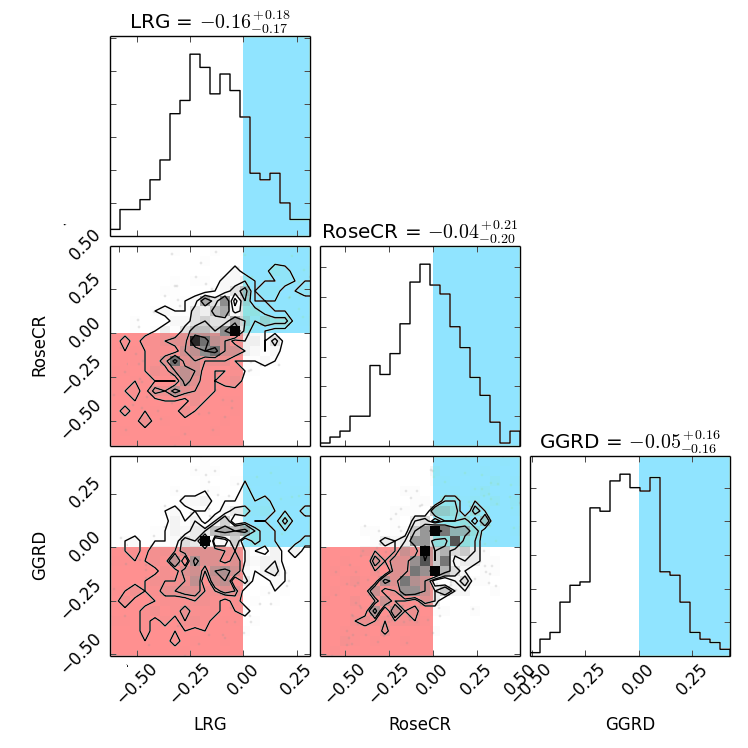 Corner plot of posterior probability for London Rollergirls, Rose City Rollers, Gotham Girls Roller Derby log(strength) with respect to Victorian Roller Derby. Positive and negative quarters coloured.
In this plot, values greater than 0 indicate "stronger than Victorian" and values less than 0 indicate "weaker than Victorian". We've coloured the 2d contour plots so that the region corresponding to both teams being stronger than VRDL is light blue, and the region corresponding to both teams being weaker than VRDL is pink. The 1-d histograms are coloured light blue in the regions where the team would be stronger than VRDL.
Firstly, it's clear from all graphs that the data strongly supports realities ("model parameters") where London Rollergirls are weaker than VRDL. The suggested most likely model parameters have London with log(strength) equal to -0.16, which corresponds to them being about 85% as strong as Victorian, but the error bars allow some variation around that, potentially as high as 1% stronger than Victorian, at the highest.
What's more interesting, and exciting for roller derby as a high end competitive sport, is that the statistics are much less definitive for Gotham and Rose. While both have most likely strengths very slightly below that of Victorian (95% and 96% respectively), the error bars actually cover almost as many cases where each is stronger than Victorian as those where they are weaker.
What this means is that, within the constraints of the statistics, and the model used, all three teams are indistinguishable in strength. If we got all three teams back onto a track to play, right now, it would be almost impossible to predict who would win each contest.
And, after 4 consecutive years where only one team had a seemingly unassailable lead over all others, this is a very positive sign.
The code used to generate these plots is available in the github repository for our statistical Derby code, as emcee-bayes.py. As with all code in this repository, it is licensed Creative Commons: Attribution, NonCommercial, ShareAlike. The code requires a data file of bout records, and is written in Python, using the emcee and numpy Python modules.
*Strictly, we actually fix the strength of VRDL to 1, as what we're interested in is the relative strengths of the teams involved. Setting a single team strength to a reference value does not compromise the generality of the solution, and gives us a free variable to use to optimise σ.
**Specifically, σ is constrained to be positive and less than 1, and the log(strength) of teams is constrained to be between -2 and 0.5 (relative to VRDL).
***σ is strictly modelled as the variation in performance for any game, not any team - if we assume that both teams vary to the same degree, then the teams will each vary by √2 of that, or 14%.
