MRDWC 2018: Post-Mortem
As is traditional (2014, 2016), we like to take a look at the Men's Roller Derby World Cup post-facto, and see how it has done in terms of fairly ranking teams. This time around, this is of particular interest because of the unusual approach to seeding "wild card" teams into brackets, on the basis of points-difference between groups.
To recap: teams were assigned to one of 6 groups (named by the colours of the rainbow - RED, ORANGE, YELLOW, GREEN, BLUE, PURPLE), with one "Top seed", and one "Second seed" in each group, the remainder of the places determined by lottery. The winners of each Group went through to the Top 8, leaving two spots free. The teams placing 2nd in each Group were compared by their points-difference (ignoring their worst game - usually against the Group winner), and the two highest also entered the Top 8. [The remaining 4 played for positions 9 through 12]. The top 4 of the teams placing 3rd-in-Group (by the same metric) played for positions 13 through 16. The bottom 2 of the 3rd-in-Groups played the top 2 of the 4th-in-Groups for 17th through 20th; the remaining teams 4th-in-Group played for 21st through 24th.
Obviously, this kind of involved "cross-group-rating" is very sensitive to the relative difficulty of the Groups - if one Group is a lot easier than the others, then their 2nd place team will have a relatively larger Points-difference due to their environment, rather than their relative skill; conversely for a Group which is harder than the others. Because we ignore results against the Top team, the most important thing to make a Group "hard" for the Top 8 wildcards is the relative strength of the weakest teams in the Groups - as they are where the other teams get more of their points difference.
As MRDWC used Points-difference, we'll be doing most of our inference also using Points-difference. We'll colour teams by the colour of the group they were assigned to in all of our charts, to make it easy to judge where each group "spanned" in terms of its components - the group winner we'll also italicise. We're also normalising the scores to 30 minutes by dividing the scores for full length games by 2 - so, if you compare two teams' estimated strengths, the difference will be about half the score difference you'd expect in a full length game between them.
| Strength Estimates (by Linear Regression) after each Day's play, equal weighting for each game. | Final Tourney Order | ||
| Days 1+2 | Days 1,2,3 | All Days | (official ordering) |
| POL:-200 DEN:-130 NZ:-120 CHI:-108 GER:-99 PHI:-94 SWE:-93 ESP:-81 JPN:-76 COL:-75 NED:-35 IRE:-28 ITA:-17 FIN:10 WAL:37 MEX:54 BEL:58 CAN:69 ARG:97 SCO:113 ENG:138 FRA:151 AUS:173 USA:257 | POL:-174 DEN:-148 NZ:-143 JPN:-129 PHI:-109 NED:-96 COL:-86 GER:-70 CHI:-38 IRE:-36 ITA:-31 SWE:-15 ESP:-4 BEL:-3 WAL:6 FIN:7 ARG:68 SCO:94 CAN:94 MEX:96 FRA:137 AUS:162 ENG:196 USA:218 | POL:-174 DEN:-150 NZ:-143 JPN:-124 PHI:-112 COL:-97 NED:-88 GER:-69 ITA:-51 IRE:-48 CHI:-23 ESP:-5 WAL:2 SWE:4 BEL:10 FIN:14 ARG:72 SCO:77 MEX:95 CAN:96 FRA:140 AUS:152 ENG:195 USA:228 | POL PHI DEN COL NZ JPN ITA CHI NED GER IRE SWE ESP BEL FIN SCO WAL ARG MEX CAN FRA AUS ENG USA |
| Range: 457 | Range: 392 | Range: 402 | |
Weighting the short games less (proportionately to their relative error), we get the following expected final rating and ranking - in general, this is very similar to the unweighted version in ranking order, except where ratings were very close.
POL:-180 DEN:-146 NZ:-141 JPN:-126 PHI:-114 COL:-95 NED:-91 GER:-71 ITA:-53 IRE:-50 CHI:-19 ESP:-8 WAL:-3 BEL:10 SWE:12 FIN:21 ARG:71 SCO:73 CAN:95 MEX:97 FRA:141 AUS:154 ENG:189 USA:235
Comparing this rating to the final tournament rating, we do see some points of agreement - the lowest and highest rated teams are where they should be by performance, and, where teams did play each other, the ordering is generally the same. (A notable exception is Spain and Sweden, who swap positions in our ranking - something which is impossible in the tournament itself, due to Sweden losing by a single point to Spain. Draws, or near-draws, are difficult things for tournaments to deal with, and in this case, whilst Spain did beat the Swedish roster they faced; Sweden did also underestimate the Spanish team strategically, playing a stronger roster might have given them the predicted score difference here. We also place Mexico and Canada closer in rating (and opposite in ranking) to the final result, which is more of a problem - Canada defeated Mexico more strongly in the group stage than in their placement bout, and our de-emphasis of this allows Canada and Mexico's performance in their previous games to push the result the other way.)Another way in which there is general agreement between the tournament results (constrained as they are by the structure of the brackets themselves), and our inferred ratings, is in that they show the groups were not of comparable difficulty. Both the tournament and both of our ratings show Purple with two teams in the bottom 5 - the only group with two teams in that situation. As the 2nd place teams are compared by their points difference relative to the lower two teams in their groups, this implies that Wales had a measurable advantage compared to their peers in other groups - this is bourne out in both the inferred rating (which places Wales outside the Top 8), and in the final tournament ranking (which placed Wales at #8, their lowest possible place as a qualifier, after bruising losses to Canada and Argentina - the latter the largest point-differential in any of the placement games).
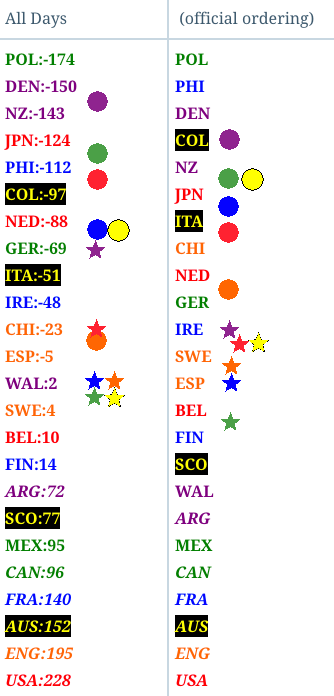 Rankings of teams, with CIRCLES added to represent average difficulty of group for 2nd Place teams (mean of 3rd and 4th Place team positions), and STARS to represent average difficulty of group for 4th Place teams (mean of 2nd and 3rd Place team positions).
By comparison, groups Yellow, Orange and Blue can all claim to have been more challenging than average, in terms of the relative strengths of the weakest two teams - and the other large movers in the top half of the table in comparison with the official results are indeed the second place teams in those groups. (Sweden, despite having a harder group, suffer still for their performance against Spain, so their final placement is perhaps still a slight underestimate.) Scotland, notably, is predicted in both ratings to have been close to Argentina - the #7 ranked tournament team - which is also backed by, again, their two performances against Australia, ending in rather similar scores.
Similar effects apply in the reverse direction for the lowest strength teams in each group: the group with the strongest 2nd and 3rd place teams penalises the weakest team relative to the other groups. In this case, this mostly affected Colombia, who had the bad luck to be in the group with Scotland; and Chile, who were in the tightest group for a 4th place team (although not the hardest), with equally-strong Sweden and Spain to face. (In general, Latin American teams other than Mexico and Argentina had pretty hard times of it, due to their relative newness on the "international" scene, compared to their actual ability - Roller Derby has been going a long time in all of Latin America, it's just expensive to get to North America or Europe from there!) Poland actually had the hardest group, but they would have been unable to qualify in the top 2 spots of the 4th Place teams even in an easier group.
In general, MRDWC 2018 did fairly well at rating teams overall, but we believe the 6 Groups into Top 8s system was too sensitive to inter-group difficulty balancing to work as well as the simpler group systems did in the previous two MRDWCs. Coupled with the geometrically increasing difficulty of making any tournament fair as the number of competitors increase, this means that at least some placements will be more likely to be off from the relative abilities of the teams. (Readers may disagree as to which teams those are, of course.) With the number of teams at future MRDWCs likely to grow - we know of at least four teams, and potentially as many as six, additional teams already which are aiming for a 2020 appearance - the next MRDWC will have to adopt a new system (and potentially add a third track) in order to scale fairly to meet the organisational challenge!
