In the News: Rating WFTDA.
Although we've written a lot on SRD [1, 2, 3 , 4 etc] and privately [1,2, 3etc] on rating and ranking Roller Derby over the years, the question of how to do this fairly in WFTDA has been another topic of discussion recently.
Like Tennis, and many other sports, the WFTDA "rankings" (which are really a rating) are not slaved to the ordering of any particular tournament, including WFTDA Championships - meaning that it is possible for the current WFTDA Champions to not also be #1 in the Rankings released at the end of the year.
Statistically, this is, of course, not a problem, but the position is still counter-intuitive to some members of the community. Some blame the specific construction of the WFTDA rating system itself, whilst others simply believe that Tournaments should supersede mathematical methods for determining rating.
As a result, every year when the WFTDA Championship winner does not automatically become the WFTDA #1 rated team, the question of "how good are WFTDA Ratings?" is raised again.
In the spirit of this, we decided to actually test this, rather than just complaining about an aspect of the rating we didn't like.
Using Flat Track Stats' records of all Roller Derby bouts, we selected the entire history of all WFTDA Sanctioned bouts in the history of the sport, all the way back to 2005. Using these, we calculated what the ratings and rankings would look like now, if we used various methods for rating teams.
"Elo" ratings, named for Arpad Elo, who developed them initially to rate performance of Chess players, are a particularly easy kind of rating to implement. As a base comparison to our other ratings, we wrote a very quick Elo rating for WFTDA Sanctioned bouts, based entirely on Win/Loss records: the rating does not care how much a team won or lost by, just that they did.
We'll compare this to three other ratings:
FTS (WFTDA): the Flat Track Stats rating, as optimised for WFTDA Sanctioned bouts. FTS is also an Elo rating, although its updates take into account the degree of success, not just that a team won; it also has a couple of other factors to account for things like home team advantage.
SRDRank (v2): this blog's in-house rating scheme. We've written a lot about this before, but it's essentially an entirely different kind of rating scheme to Elo; rather than updating pairs of teams on each game, SRDRank is a Massey-style scheme, which tries to produce consistent ratings to explain all of the games in its "purview" at once. This version of SRDRank was optimised for monthly predictions, against the world, not just the smaller subset of WFTDA Sanctioned games.
WFTDA: the official WFTDA rating and ranking, which is used to rank teams for selection into the official WFTDA tournaments. WFTDA ratings are specifically designed to be "easy for people to understand" without specialist knowledge, as well as, presumably, aiming to reflect the history of performance of their member leagues.
Predictive accuracy
The key conflict between expectations of Rating systems and the reality, is often one between "prediction" and "postdiction".
"Prediction" is, of course, using a rating to guess what a future result would be, by comparing the ratings of the competitors previously.
"Postdiction", conversely, is using a rating to judge "how well" two teams have performed, over their recent history.
Whilst it may seem that the two are closely related, in fact, it isn't inherently true that a rating which has high accuracy at one is also highly accurate at the other. In general, prediction is harder than postdiction - it's always hard to guess what's going to happen beforehand - but for teams whose strength has varied a lot over their season, it also can be hard for a postdictive approach to represent their "overall performance" in a satisfying way.
In neither case, of course, does "high accuracy" mean "always places the winner of a particular tournament at #1". All rating systems are statistical, and try to produce the best overall measure of performance, for all teams, and all possible contests. The difference between the top teams is just as relevant as those between the middle and lowest rated teams.
Equally important to the accuracy of a rating - at either task - is the frequency at which it is updated. Elo ratings, including the FTS ratings, are designed to update every time a game happens, so their accuracy can be measured either side of a given result. Some other ratings are published less frequently - WFTDA's ratings are monthly to bimonthly, depending on the time of year, and SRDRank is designed to produce predictions no faster than daily. Frequent ratings aren't necessarily the "best" ratings, especially for postdiction - a "long-term overview" can sometimes produce a better overall view of historical performance than a rapidly updated one focused on bout-by-bout changes; but for prediction, especially in the middle of tournaments, it's usually best to have all the most recent information available for your next bet.
To illustrate this, we've plotted the performance of four different ratings, at both postdiction and prediction, when we take updates at yearly, quarterly, monthly, fortnightly, and "bout-by-bout" intervals. For some rating schemes, not all intervals were available: FTS doesn't easily provide "historical rating" collections for anything more frequent than quarterly results. (We have a single data point for the FTS "bout-by-bout" period, for prediction, thanks to Ioan Wigmore.); WFTDA ratings are not updated faster than monthly at best; SRDRank doesn't produce "bout-by-bout" updates for this kind of data.
In all cases, the postdiction accuracies (as percentage "correct") are shown by triangles, and the prediction accuracies by circles; the same colour is used for a given rating scheme. More "rapid" updates are to the left of the graph.
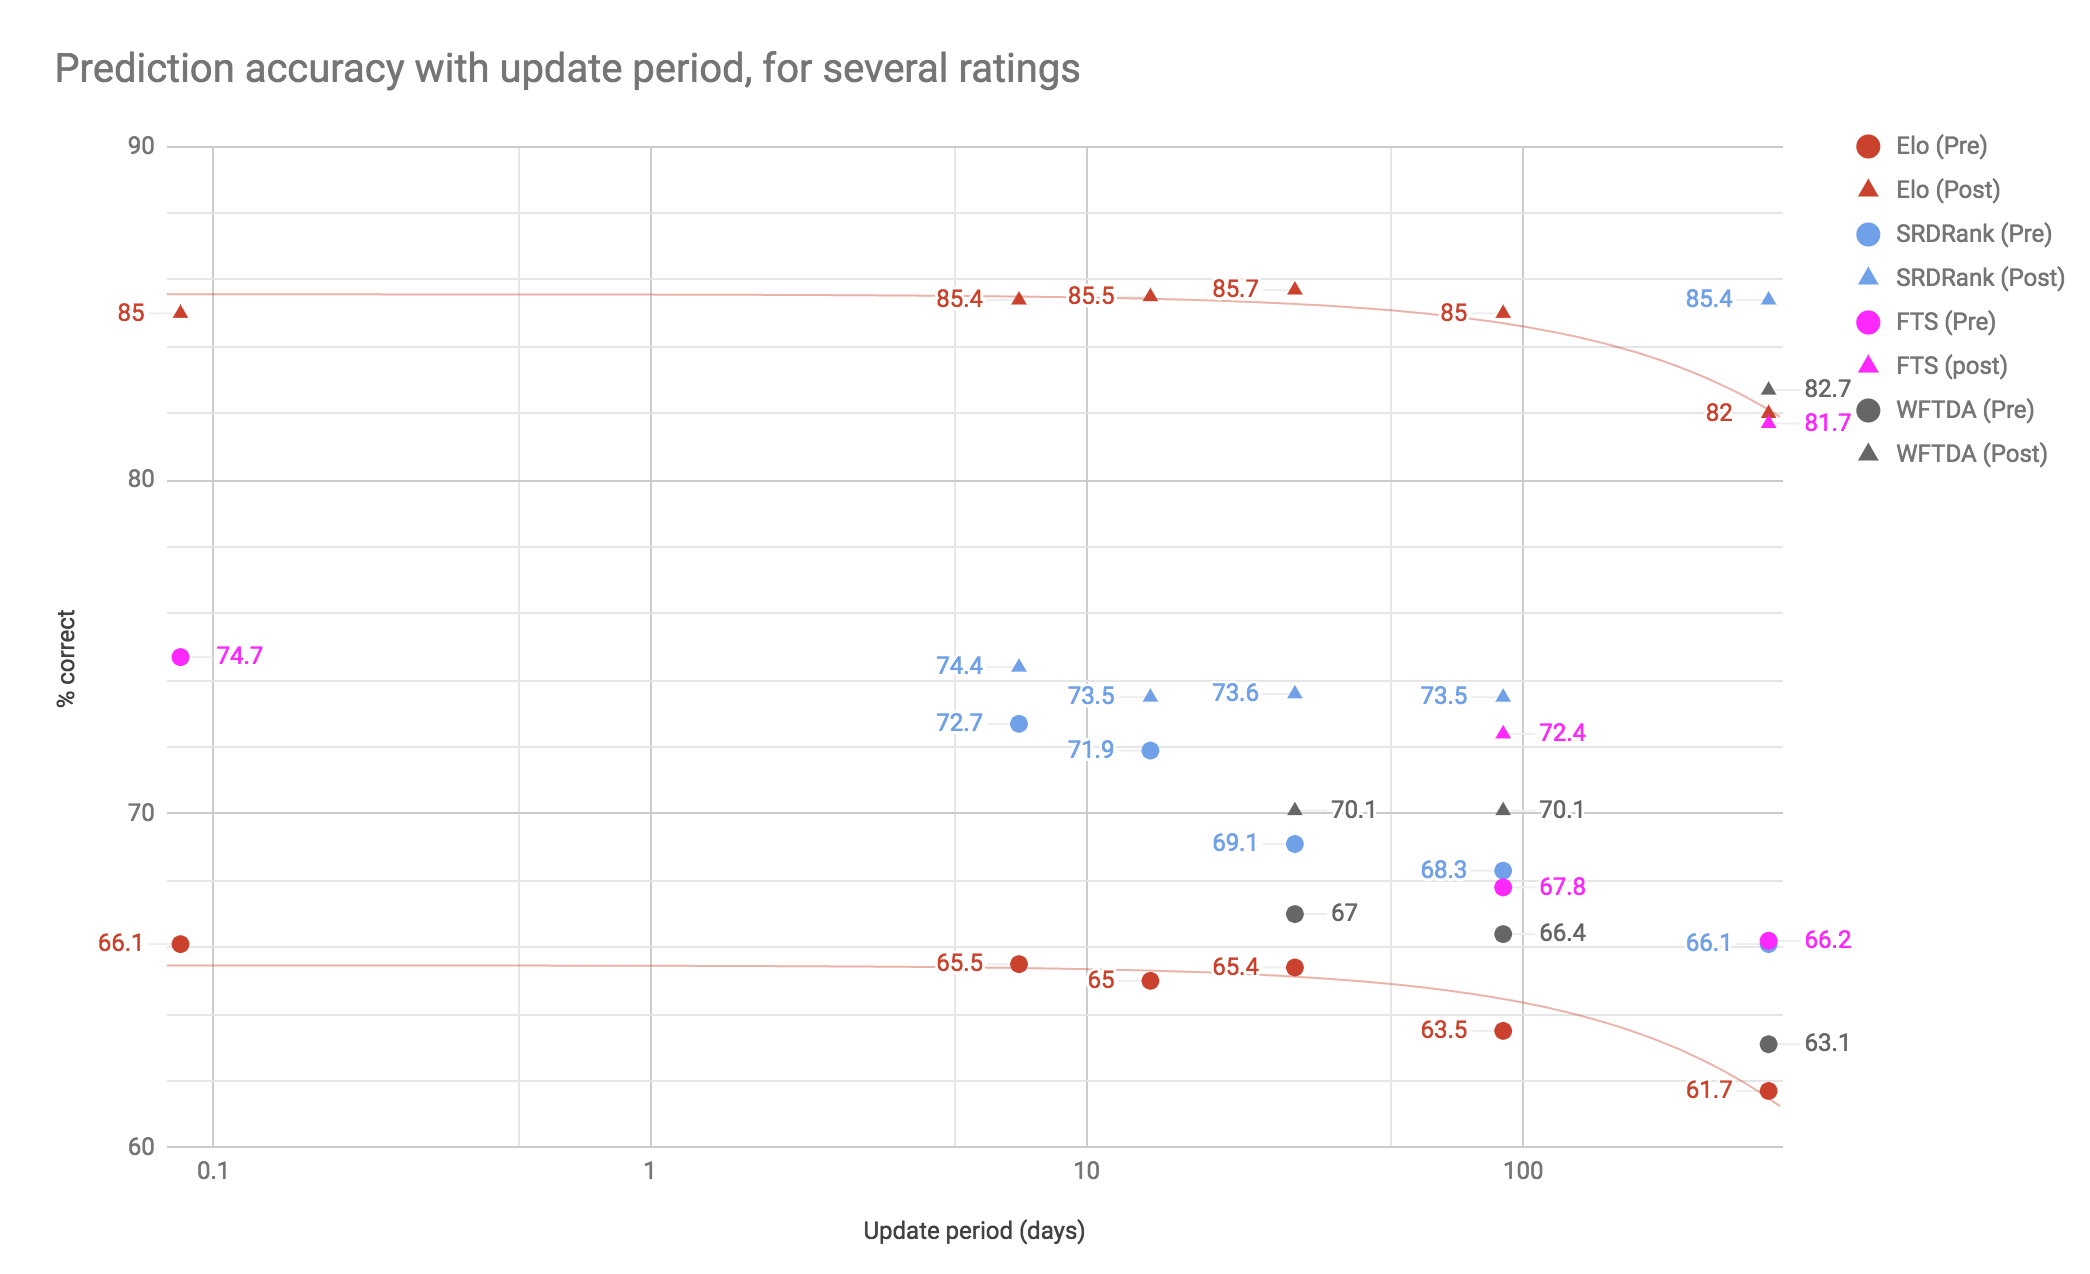
The first thing that should be clear is that postdiction is, in general, easier than prediction: every rating has a higher postdiction accuracy than prediction accuracy, for every update period.
The Elo rating has some of the highest postdiction accuracies, partly because it responds "fully" to every win or loss: a win counts 100%, even if it was a narrow victory, so each result pulls the rating around strongly, making it reflect history. This tendency to be "recency-biased" also explains why its postdiction gets "better" on shorter updates: a "weekly" postdiction only has to represent the last week of play accurately, and that's what Elo is best at. When we need the Elo rating to represent an entire year of performance, its bias towards the most recent month harms it overall.
That same effect, also means that the Elo rating is also the worst at prediction: because it counts all wins equally, a single narrow upset can throw off any trend it was measuring.
SRDRank and FTS are closely matched for the update periods where they can be compared, with SRDRank having a slight advantage in prediction, and a noticeable one in postdiction; by comparison, the WFTDA rating is worse than all other ratings at postdiction, except on the yearly scale, and only better than the Elo rating at prediction. SRDRank is particularly good at "yearly review" postdiction: representing the entire year's performance overall; this is because of design decisions which mean that it considers an 18 month period of games in order to make its rating evaluation. The same "long term" view means that its postdictions are worse at reflecting "short term" history than the recency-focused Elo, although it still out-performs every other metric at this task.
The WFTDA rating, meanwhile, is hampered by having a maximum amount it can respond to any "strength change", meaning that it struggles to keep up with the more performant ratings on postdiction; and its simple rating calculation is not sophisticated enough to predict well.
For prediction, the "sports prediction" literature generally considers accuracies above about 70% to be excellent. On that measure, only two ratings are excellent for Roller Derby prediction: SRDRank (fortnightly or weekly updates), and FTS ("bout by bout", although it is likely that it would also be excellent on the same timescales SRDRank is). It is likely that better than 75% or so win/loss prediction accuracy is impossible for Roller Derby: there are always closely-matched games which "could go either way", which even an accurate algorithm will guess wrongly about half the time by definition.
We should also say that, by this measure, the WFTDA rating isn't that bad at all, only just missing out on that 70% benchmark, although it's not in the same class as the other two schemes.
For postdiction, there are less expectations on excellence, as the difficulty is partly dependant on how "variable" the sport is. The ~85% accuracy attained by Elo (quarterly or shorter) and SRDRank (yearly) is exceptional, however. The WFTDA rating actually does fairly well at "yearly" postdiction - summarising the years' performance in a single measure - but it is worse than every other metric when applied on a more frequent basis.
Predictive Accuracy (with close misses)
As we mentioned above, simply judging a rating on its ability to call wins and losses causes problems when evaluating close games. A good rating will predict that a close bout will be close; but inevitably, random chance will cause it to be wrong about which one of the contestants will actually win.
There are several ways in which we can correct for this issue: we can move to measuring the success at predicting actual score-lines (not just winners and losers), but this is hard to compare for our metrics (mainly as the Elo rating isn't designed to predict score-lines); or, we can give credit to the rating for results it gets wrong if the game was close, and the rating predicted it to be close.
[As an aside: SRDRank was actually optimised against the first metric: getting score-lines as close as possible, for the entire world's history of games.]
As an example of how this changes our evaluation of ratings, we've graphed the accuracies of the Elo and SRDRank ratings again, for both pre- and post-diction. This time, we've included a second set of points for each: the success measured, including games which the rating called the winner wrong, but correctly predicted the result to be close either way (within 10% on the scoreline).
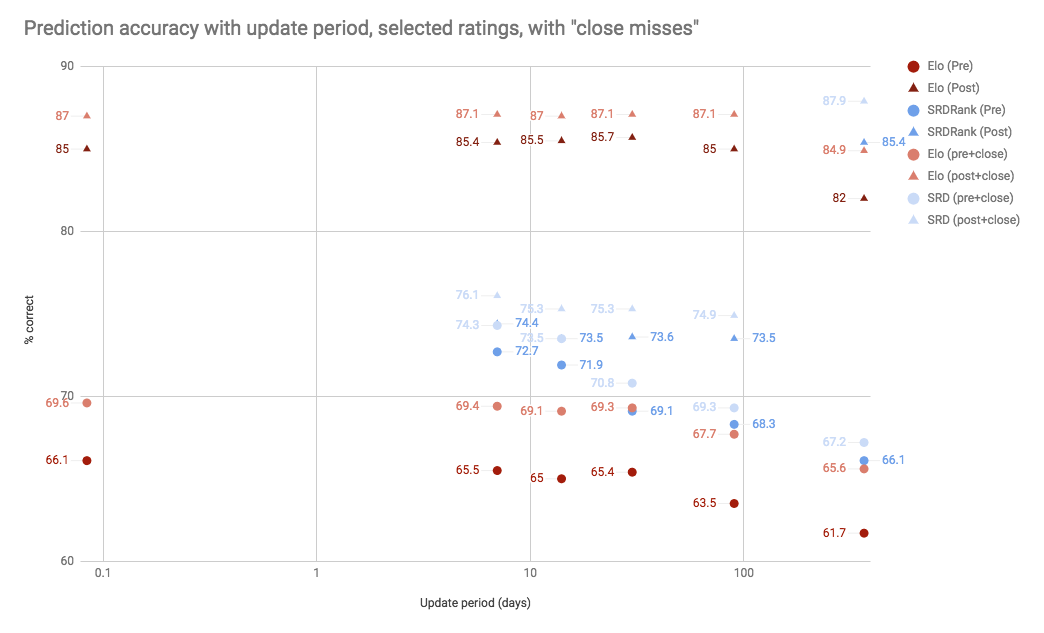
As you can see, including "close games" results in a significant boost to our evaluation of all the metrics, although it does not "reverse the order" of any of our ratings in terms of relative performance. (Notably, SRDRank's yearly postdiction now narrowly beats all comers when you include close games, even defeating Elo's best postdiction with close games.)
Although we did not include them on the graph (in order to make the graph still somewhat readable), we'd expect similar gains for the FTS and WFTDA ratings; an average of around 2% additional "successes" for each test.
Best Rating for a Job
Given the metrics above, we can attempt to select the "best" ratings to use for a particular task. We've selected four representative tasks, and mapped them to the mode (pre- and post-diction) and "timescales" on which they operate, to select recommendations, and warnings, on the approaches you should consider.
Season Review is the task of summarising, as best you can, the overall performance of the field over the past season. This is a postdiction task, on a long timescale (six months to a year). This is also a very closely contested task, and there's not much to call between all 4 ratings.
Medium-term Prediction is the task of predicting results several weeks to months in advance, to plan tournaments and games.
Play-by-Play Prediction is the task of predicting results on the minute, judging your next game at a tournament, for example.
Medium-term Review is the task of summarising, the overall performance of the field, on the scale of months. This is the "coaching" metric, when judging how well your team is evolving. For this, second place is very tight.
| Task | Best | 2nd Best | Worst |
| Season Review (Yearly postdiction) |
SRDRank | WFTDA | FTS & Elo (joint) |
| Medium-term Prediction | SRDRank | FTS | Elo |
| Play-by-Play Prediction | FTS | SRDRank (weekly) |
Elo |
| Medium-term Review (Quarterly postdiction) |
Elo | SRDRank & FTS (joint) |
WFTDA |
Yearly Performance Ratings
We can also (bearing in mind the relative expectations of accuracy, as discussed in the rest of this article), generate the full "rankings" for all of the WFTDA member leagues for 2018. (The WFTDA Ranking here is the one from 30 Nov 2018, the most recently available ranking and rating from WFTDA).
We present here the top 20, with ratings, from each scheme - notice that, despite the differences, there are far more similarities than disagreements.
(Ratings are truncated for space: the error introduced by truncation rather than rounding is much smaller than the expected error on the ratings themselves, so this is not an issue.)
Top 20s (Tabular)
| Rank | WFTDA | SRDRank | Elo | FTS |
| 1. 2. 3. 4. 5. |
Victoria (1255) Rose (1241) Gotham (1174) Denver (1162) Arch Rival (1110) |
Victoria (3.36) Rose (3.35) Gotham (3.15) Denver (3.07) Arch Rival (3.03) |
Rose (2637) Victoria (2592) Gotham (2516) Arch Rival (2281) Angel City (2267) |
Rose (1005) Victoria (1003) Gotham (984) Denver (977) Arch Rival (962) |
| 6. 7. 8. 9. 10. |
Angel City (904) Montreal (871) Texas (857) Jacksonville (841) Crime City (827) |
Angel City (2.71) Texas (2.57) Montreal (2.49) Crime City (2.48) Jacksonville (2.41) |
Denver (2262) Texas (2182) Montreal (2167) Jacksonville (2102) Minnesota (2100) |
Angel City (946) Texas (924) Montreal (901) Crime City (899) London (890) |
| 11. 12. 13. 14. 15. |
Atlanta (778) London (767) 2×4 (713) Helsinki (704) Santa Cruz (693) |
London (2.34) 2×4 (2.33) Rainy City (2.27) Canberra (2.25) Atlanta (2.24) |
London (2087) Crime City (2084) Atlanta (2070) Oly (2055) Dallas (1974) |
Rainy City (887) Jacksonville (885) Minnesota (880) Atlanta (880) 2×4 (875) |
| 16. 17. 18. 19. 20. |
Minnesota (691) Rainy City (686) Rat City (686) Arizona (655) Stockholm (648) |
Helsinki (2.15) Rat City (2.13) Minnesota (1.99) Bay Area (1.96) Santa Cruz (1.94) |
Bay Area (1951) Rainy City (1941) Philly (1938) Arizona (1928) Santa Cruz (1925) |
Rat City (874) Santa Cruz (870) Bay Area (866) Helsinki (863) Canberra (849) |
All WFTDA Leagues (graph, image)
As we've previously discussed, however, strict rankings are a bad way to represent the performance of teams. It's much better, even with 1-dimensional ratings, to report those ratings, providing a better measure of the "distance" between teams, than to imply that all teams are equally "1 better" than the team immediately "below" them in ranking.
As such, we've generated a graph of all the teams rated by at least one of our ratings in their yearly review. We order the teams in "WFTDA ranking" order, with teams not in the official WFTDA ranking placed at the end.
In order to provide a good comparison, we've rescaled all the ratings to represent logarithmic relative strength, compared to the "top" team in the rating*. (That is: for every "1" difference in rating, the better team is expected to score about 2.7× as much in a game; for every "2" difference, 2.72× (7.4×), for every "3" difference, 2.73× (20×) and so on.)
This image is unavoidably large in order to be legible; click the preview to get the full-size version.
Note that the full range of the entire rated cohort for all ratings is about 8, corresponding to the top 3 teams being expected to score around 3000× more points than the bottom 3 (or, effectively, a complete shutout).

It's worth noting that, in general, there's still a reasonable agreement on the overall "shape" of the rating; the ratings all broadly agree on the strength difference between the top and bottom ends of the list, and whilst there are disagreements in order, there's also a lot of agreement about the overall place of most teams.
It's also possible to see how the "difference in skill between ranks" changes: the steeper the slope of the curve, the more change there is in relative skill as you change ranking. For WFTDA Member leagues, there seems to be a relatively flat middle section, where adjacent teams are actually very close in strength; at the top end, there's a much steeper rating change with rank, until the curve flattens again around the top 3 or 4. (All the ratings pretty much agree that Victoria and Rose are near-tied in the top 2, they just disagree about which is a tiny sliver ahead.)
Conclusion
We've given an overview and test of the official WFTDA rating scheme, versus 3 contenders for a range of use cases.
Contrary to some complaints, the WFTDA rating scheme turns out to be a pretty good rating, for post-diction, on the longer timescales.
More sophisticated schemes do better than it at almost all tests, but its performance, given its simplicity and the trade-offs it makes to try to prevent high-skill teams playing low-skilled teams for blowouts all the time, is acceptable.
Also, this test run underlines just how hard it is to make gains in predicting (or postdicting) game results: the gap between the worst and best performing metrics in this test is never more than 10%, and the gap between the "good" ratings tends to be around the 1% level.
We do note that, for prediction, Flat Track Stats attains class-leading performance, especially on short time scales. (It is just as good when rating European teams, MRDA teams, or any other region where it has an actively calculated rating.) We'd encourage regions which do not have their own rating scheme to contact Flat Track Stats to host such a thing for them. (The other benefit to this is that you have a place to store all your results: Flat Track Stats is also a public repository of all the game data which is uploaded to it.)
*WFTDA estimated strength differences are calculated using the predicted strength ratios in the WFTDA algorithm, not the predicted "points gained". Other calculators use the points-gained formula, as they're interested in seeing how the rating changes with results: we're interested in how strong WFTDA's rating actually thinks teams are, which is different. (The fact that these are different for WFTDA is why sufficiently strong teams can't play weak teams without losing overall rating: points gains doesn't keep pace with strength difference. None of the other rating schemes in this article have this behaviour.)
